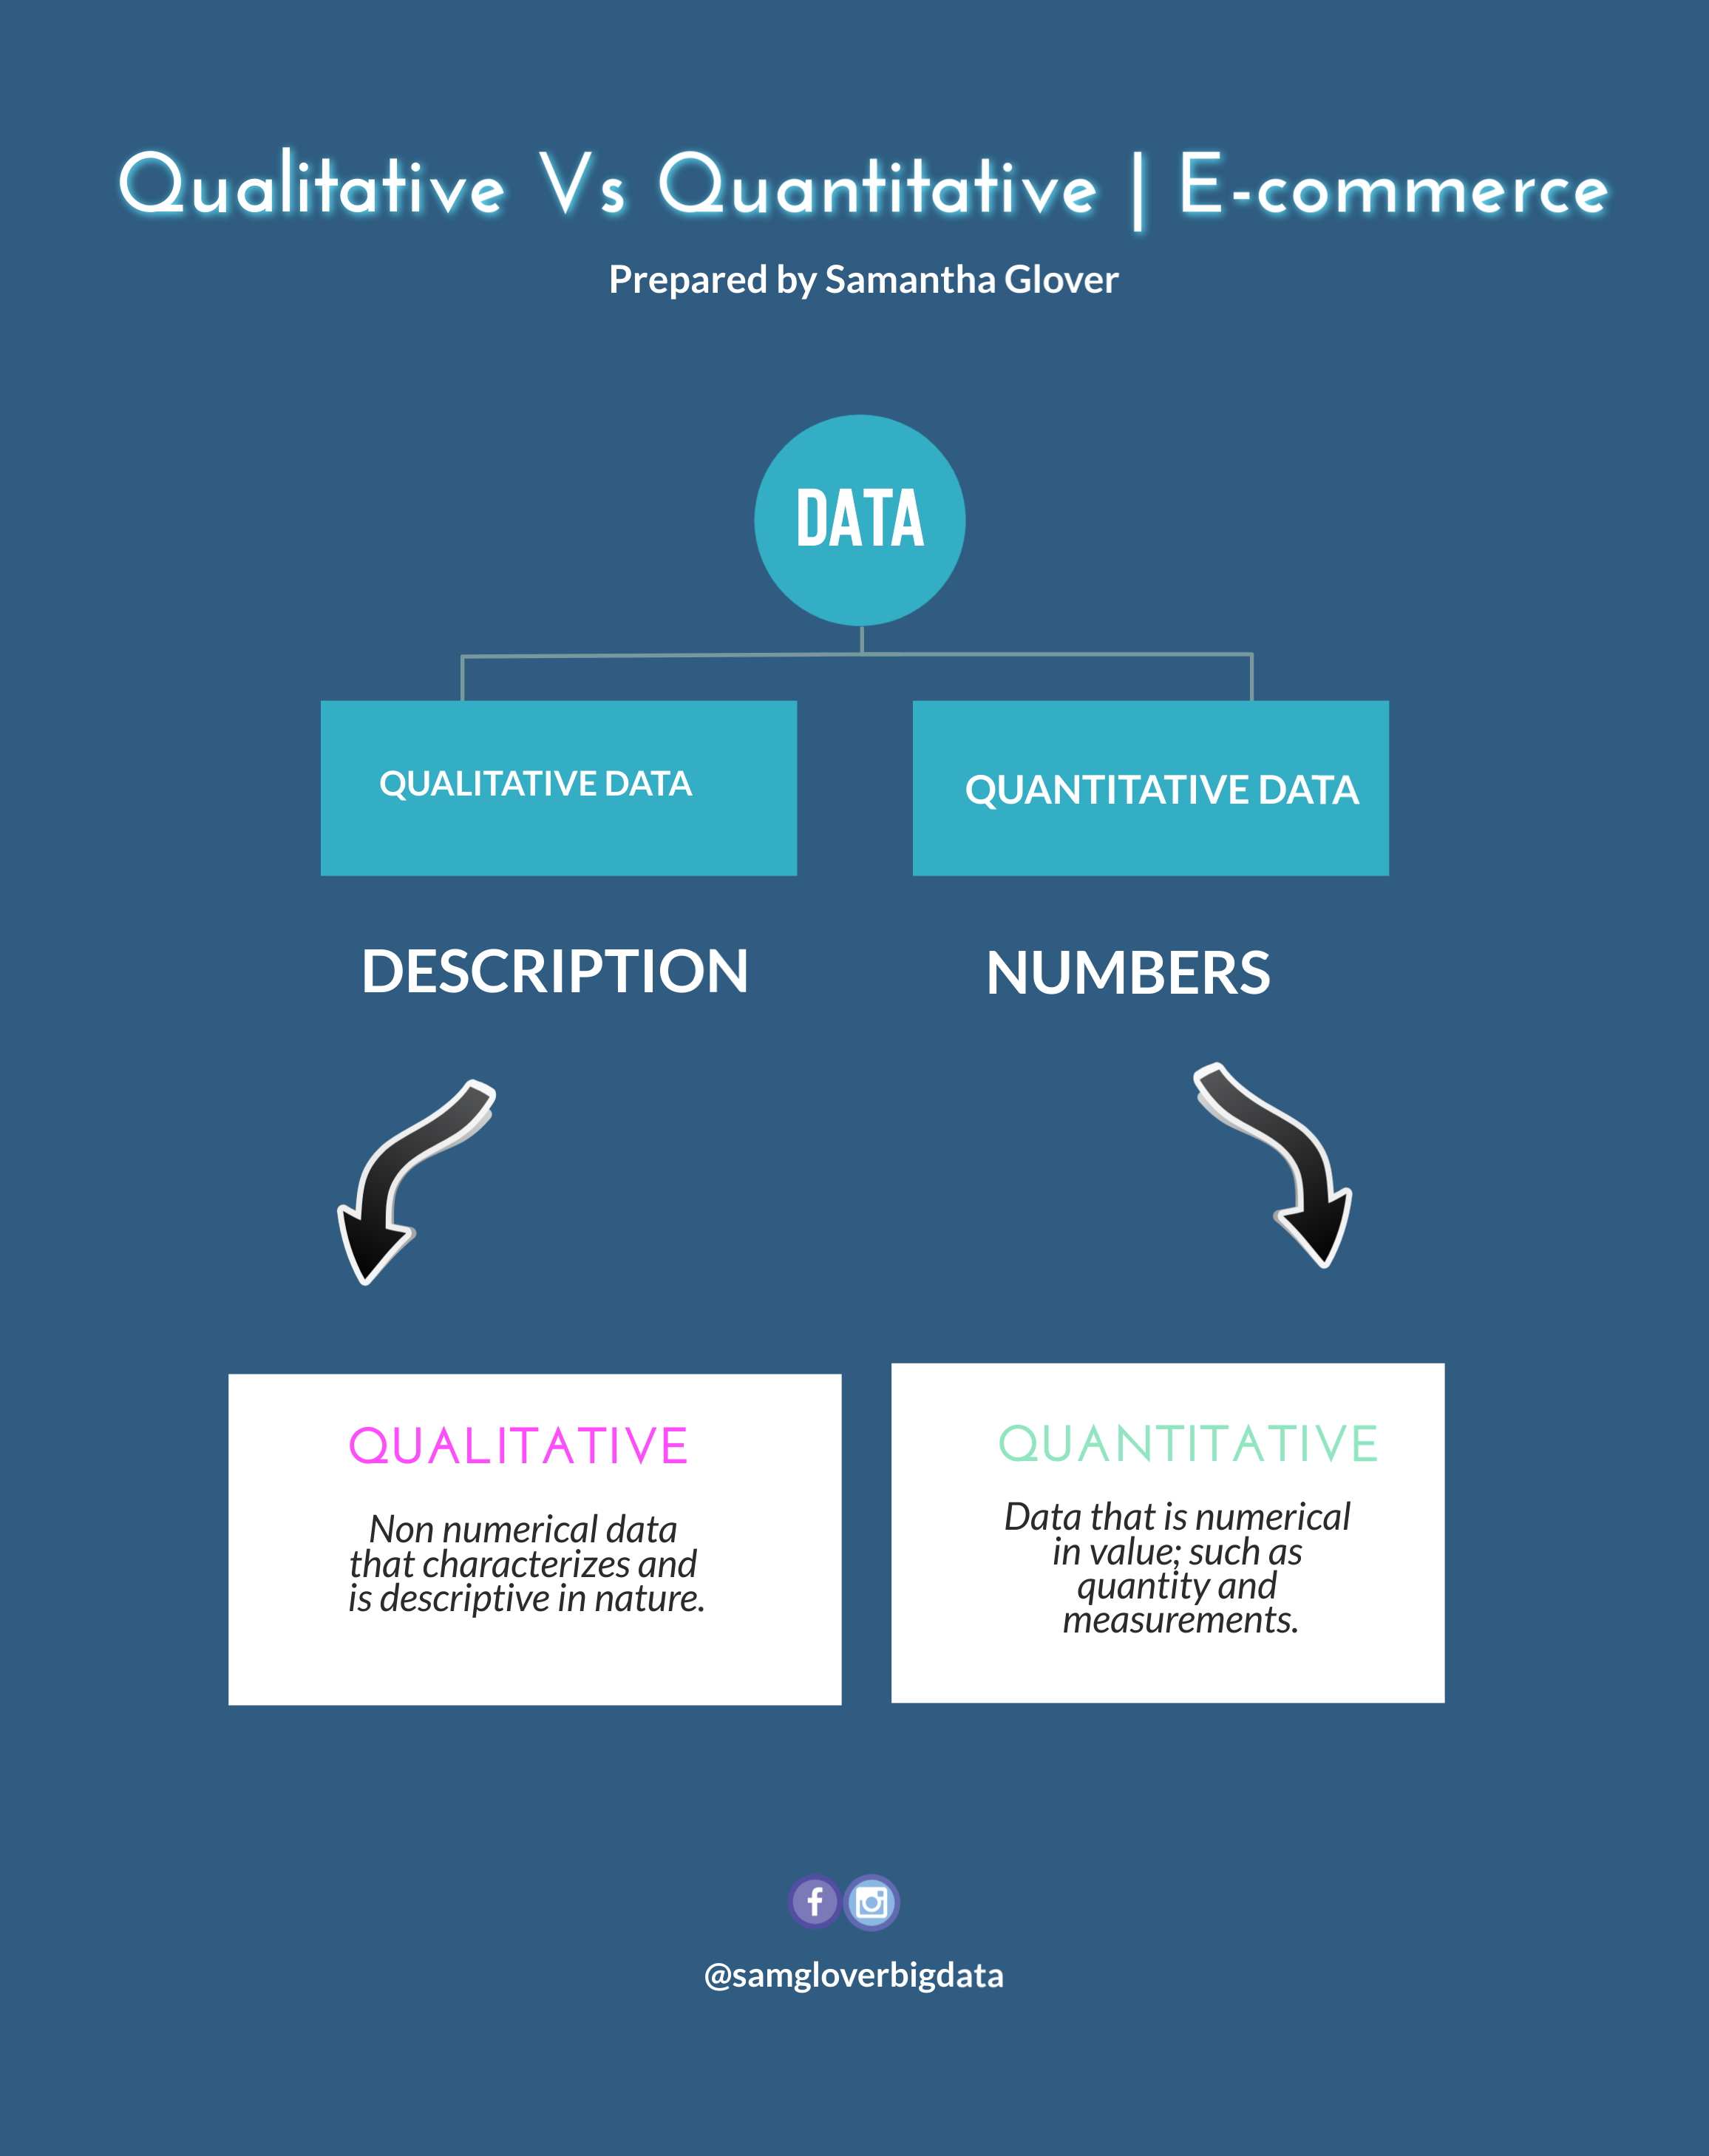
When exploring a new data set, especially when a client has data but they are unsure or have no expectations. There are several ways of observing and positioning data for exploration.
Let’s start with what is listed in the slide below. I like to throw in basic as well as advanced methodologies as I have a mixed audience.
The first thing I would want to do is to segment out qualitative vs quantitative data. Qualitative data has description qualifiers whereas quantitative data involves numbers. You can tie in a numerical value to qualitative data but you first have to identify what is qualitative vs quantitative.
Such as plant based milk being qualitative vs market value growth of plant based milk over the last 5 years, or a prediction model of the potential growth regarding plant based milk in the next 5 years to come.
Let’s apply this to e-commerce. If we have a clothing line with an online store. The clothing store has products made of leather from animals. We can segment and group the different types of animal leather products vs plant based products that are cruelty free and not made out of animals.
Now that I have grouped my qualitative data, I now want to add a quantitative value to it, in order to see if there is a surge or growth in plant based leather products.
I for one support cruelty free so without bias I would like to say I would show my findings if and how plant based leather may disrupt the leather industry and to convince my client to evolve and invest in plant based leather.


